Visidata
Usually when some kind of pretty-CSV tool pops up on the internet, I look at it, it seems okay for a bit, but then I revert back to using less or vim.
I had almost considered starting a project to use Textual to make a SQL viewer/editor. But then I saw that harlequin did that already and is featured on the Textual page, and was so poorly implemented enough that I couldn’t even run queries in my first attempt. It was discouraging enough to make me to want to try and serious project on it.
Luckily, I stumbled upon Visidata, and I think that vd might be here to stay:
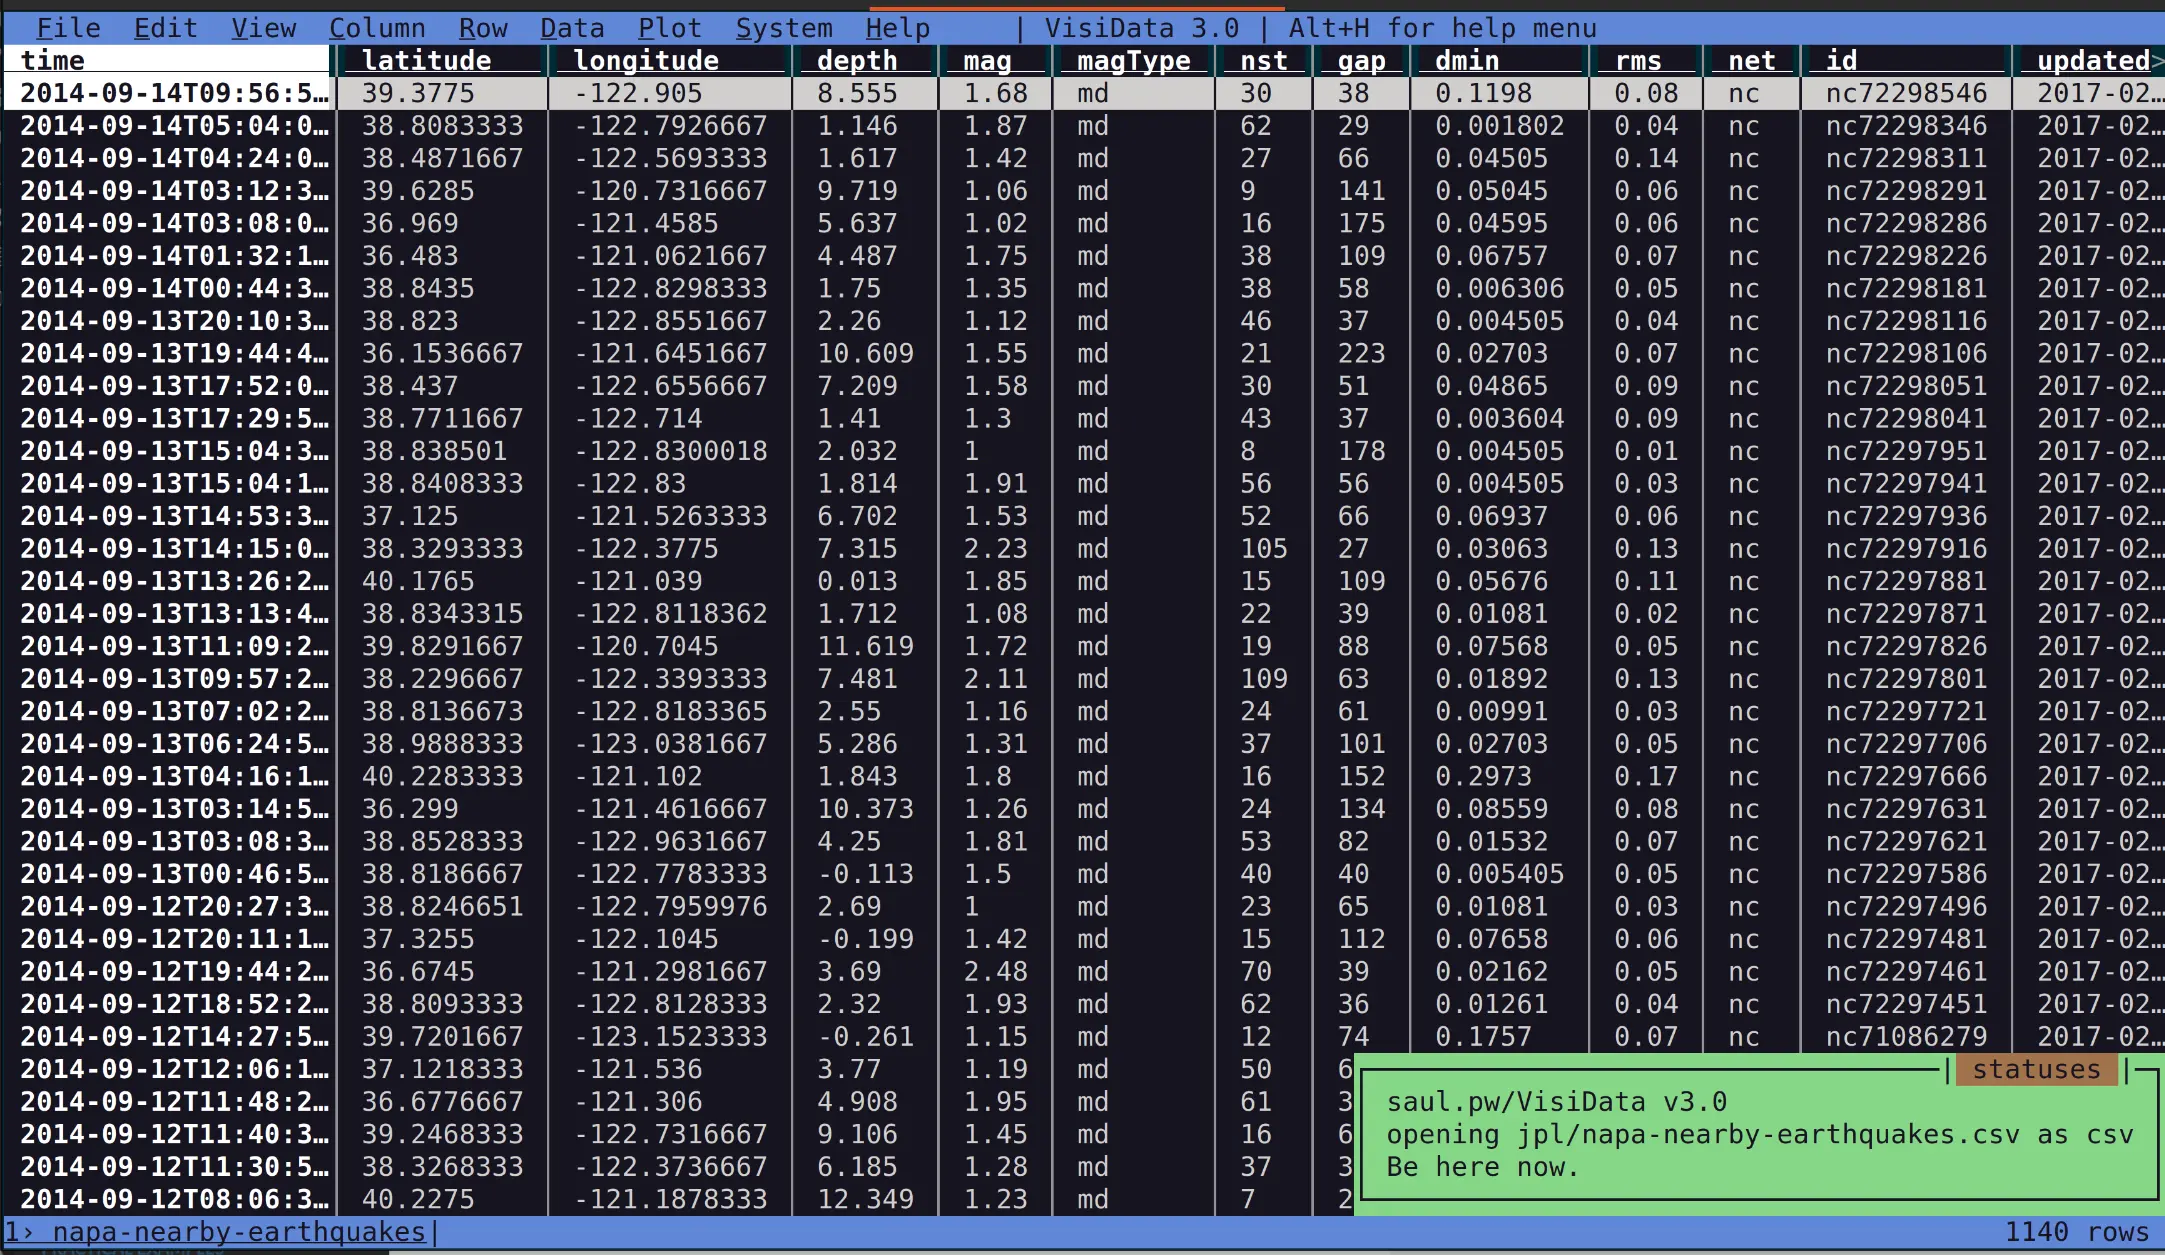
It’s very for quick viewing, and it’s clearly built for power users that want to quickly bounce around and poke at data. It even has some of the first basic plots in the terminal that didn’t make me cringe:
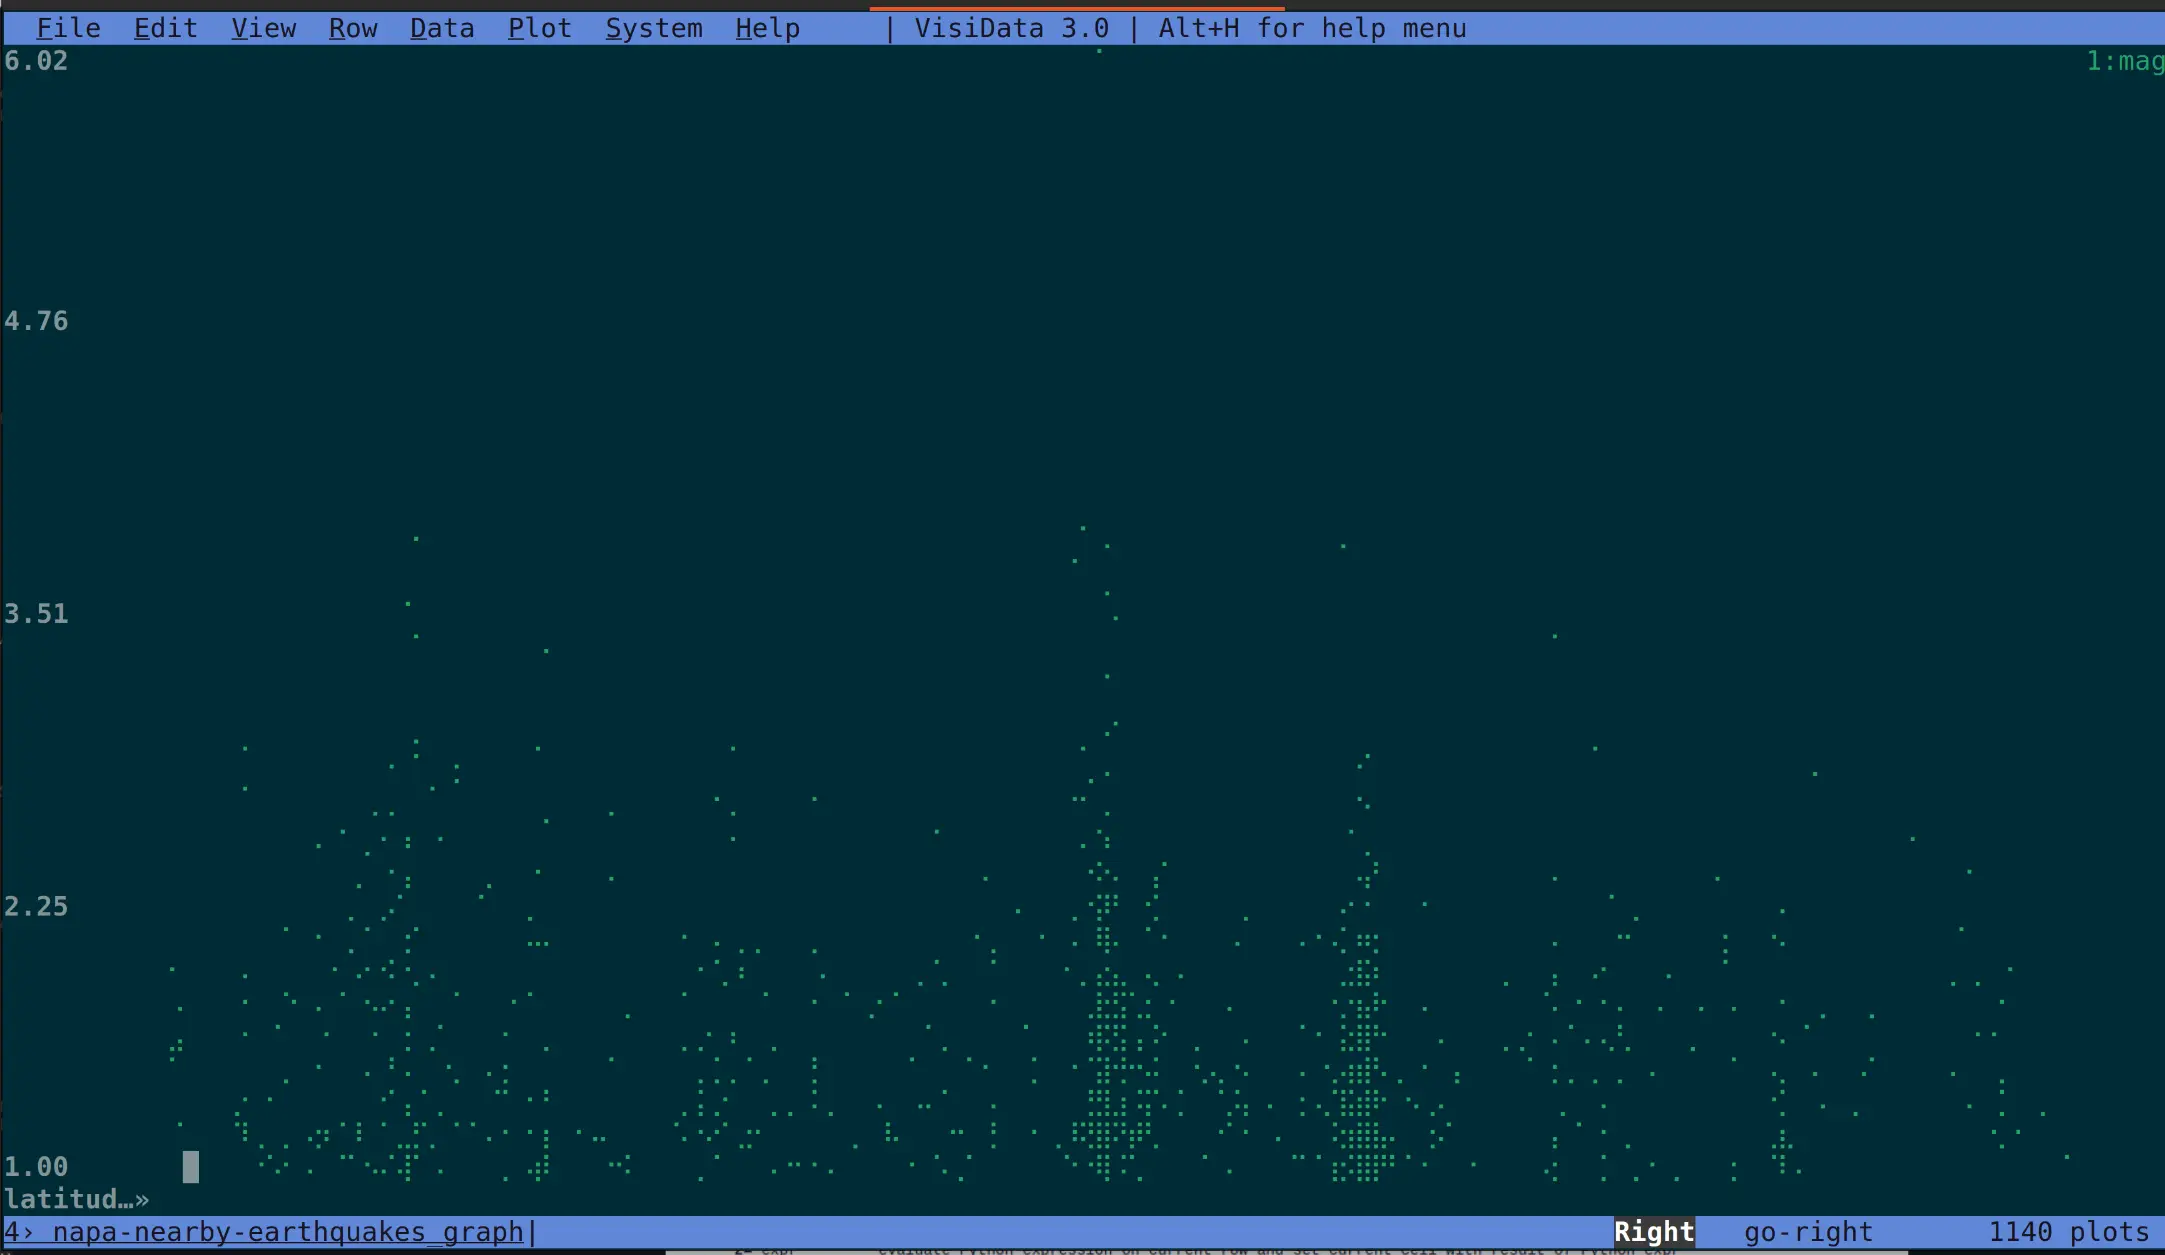
This was the magnitude of earthquakes vs. time for all recorded earthquakes near the big 2014 Napa one.
The one (big?) downside is that it doesn’t seem to let you run SQL on the files… I don’t really understand why, but it might be because of the choice to use Ibis on the backend. Ibis seems to want to replace Pandas but have a better intermediate/backend representation of data… but I really would rather write SQL for a lot of cases.
References
- https://www.visidata.org/
- https://www.visidata.org/docs/graph/
- https://ibis-project.org/