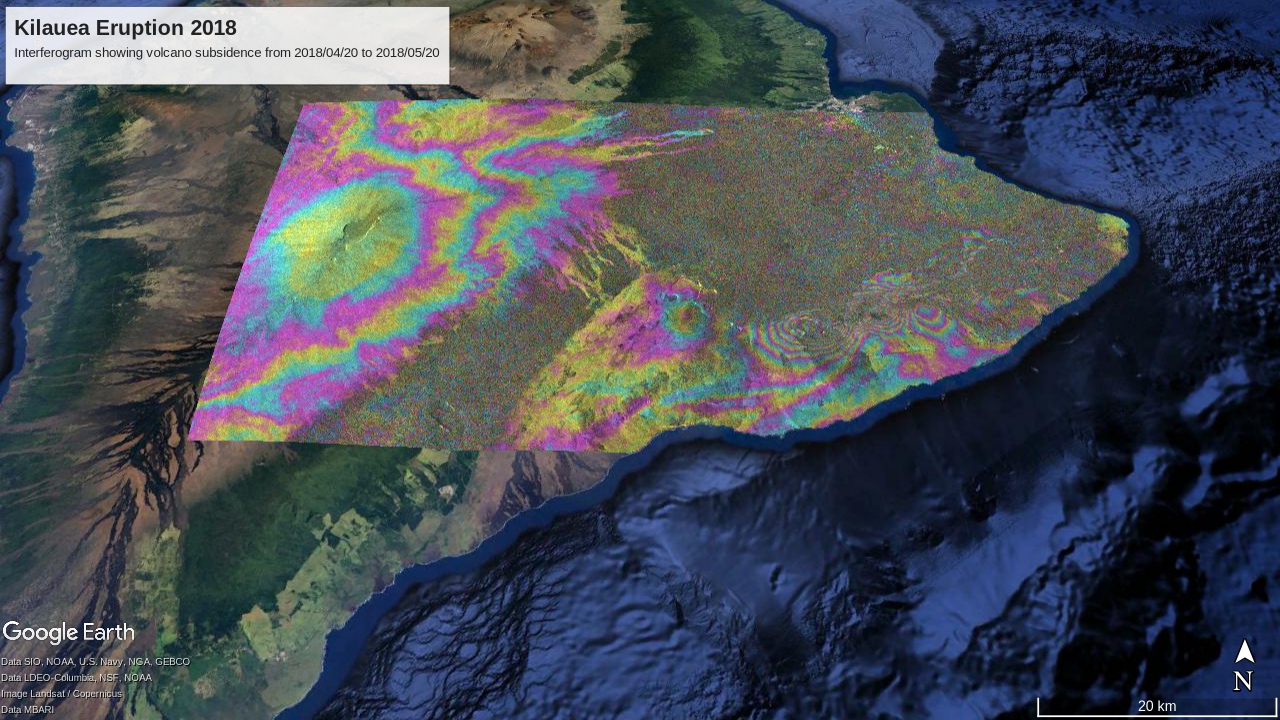
My research uses satellite radar interferometry (InSAR) to measure millimeter-level changes to Earth’s surface over time. InSAR has a huge variety of geophysical applications, like mapping ground deformation due to the 2018 eruption of Kilauea:
At NASA’s Jet Propulsion Laboratory, I led the algorithm development team for the OPERA Sentinel-1 Surface Displacement product, the first continental-scale InSAR ground motion product over North America.
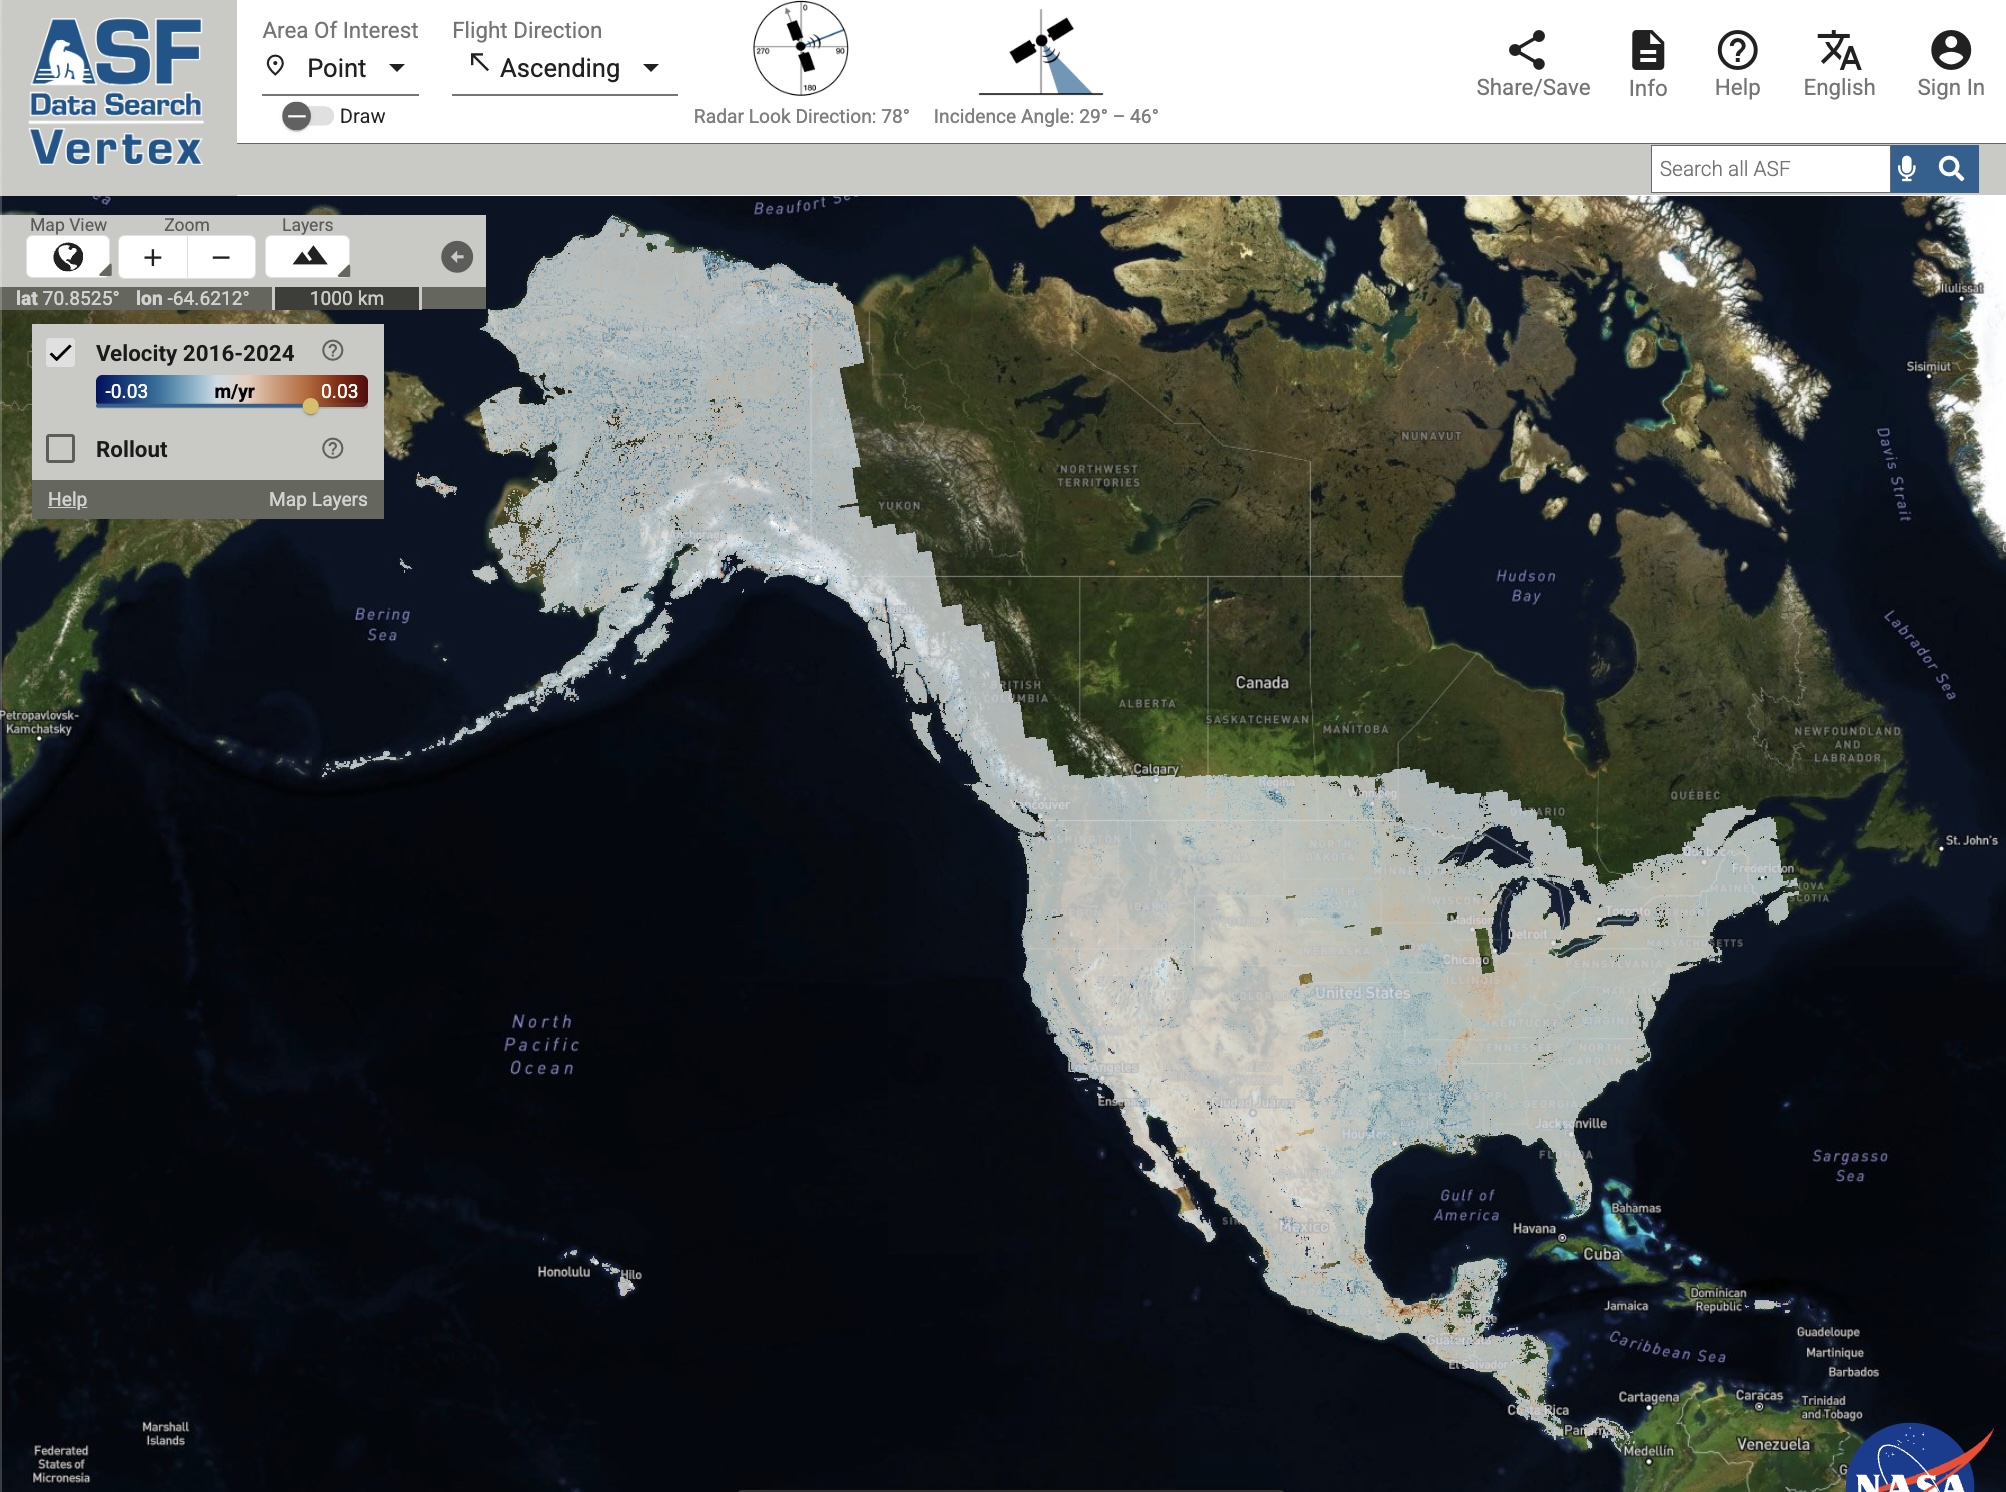
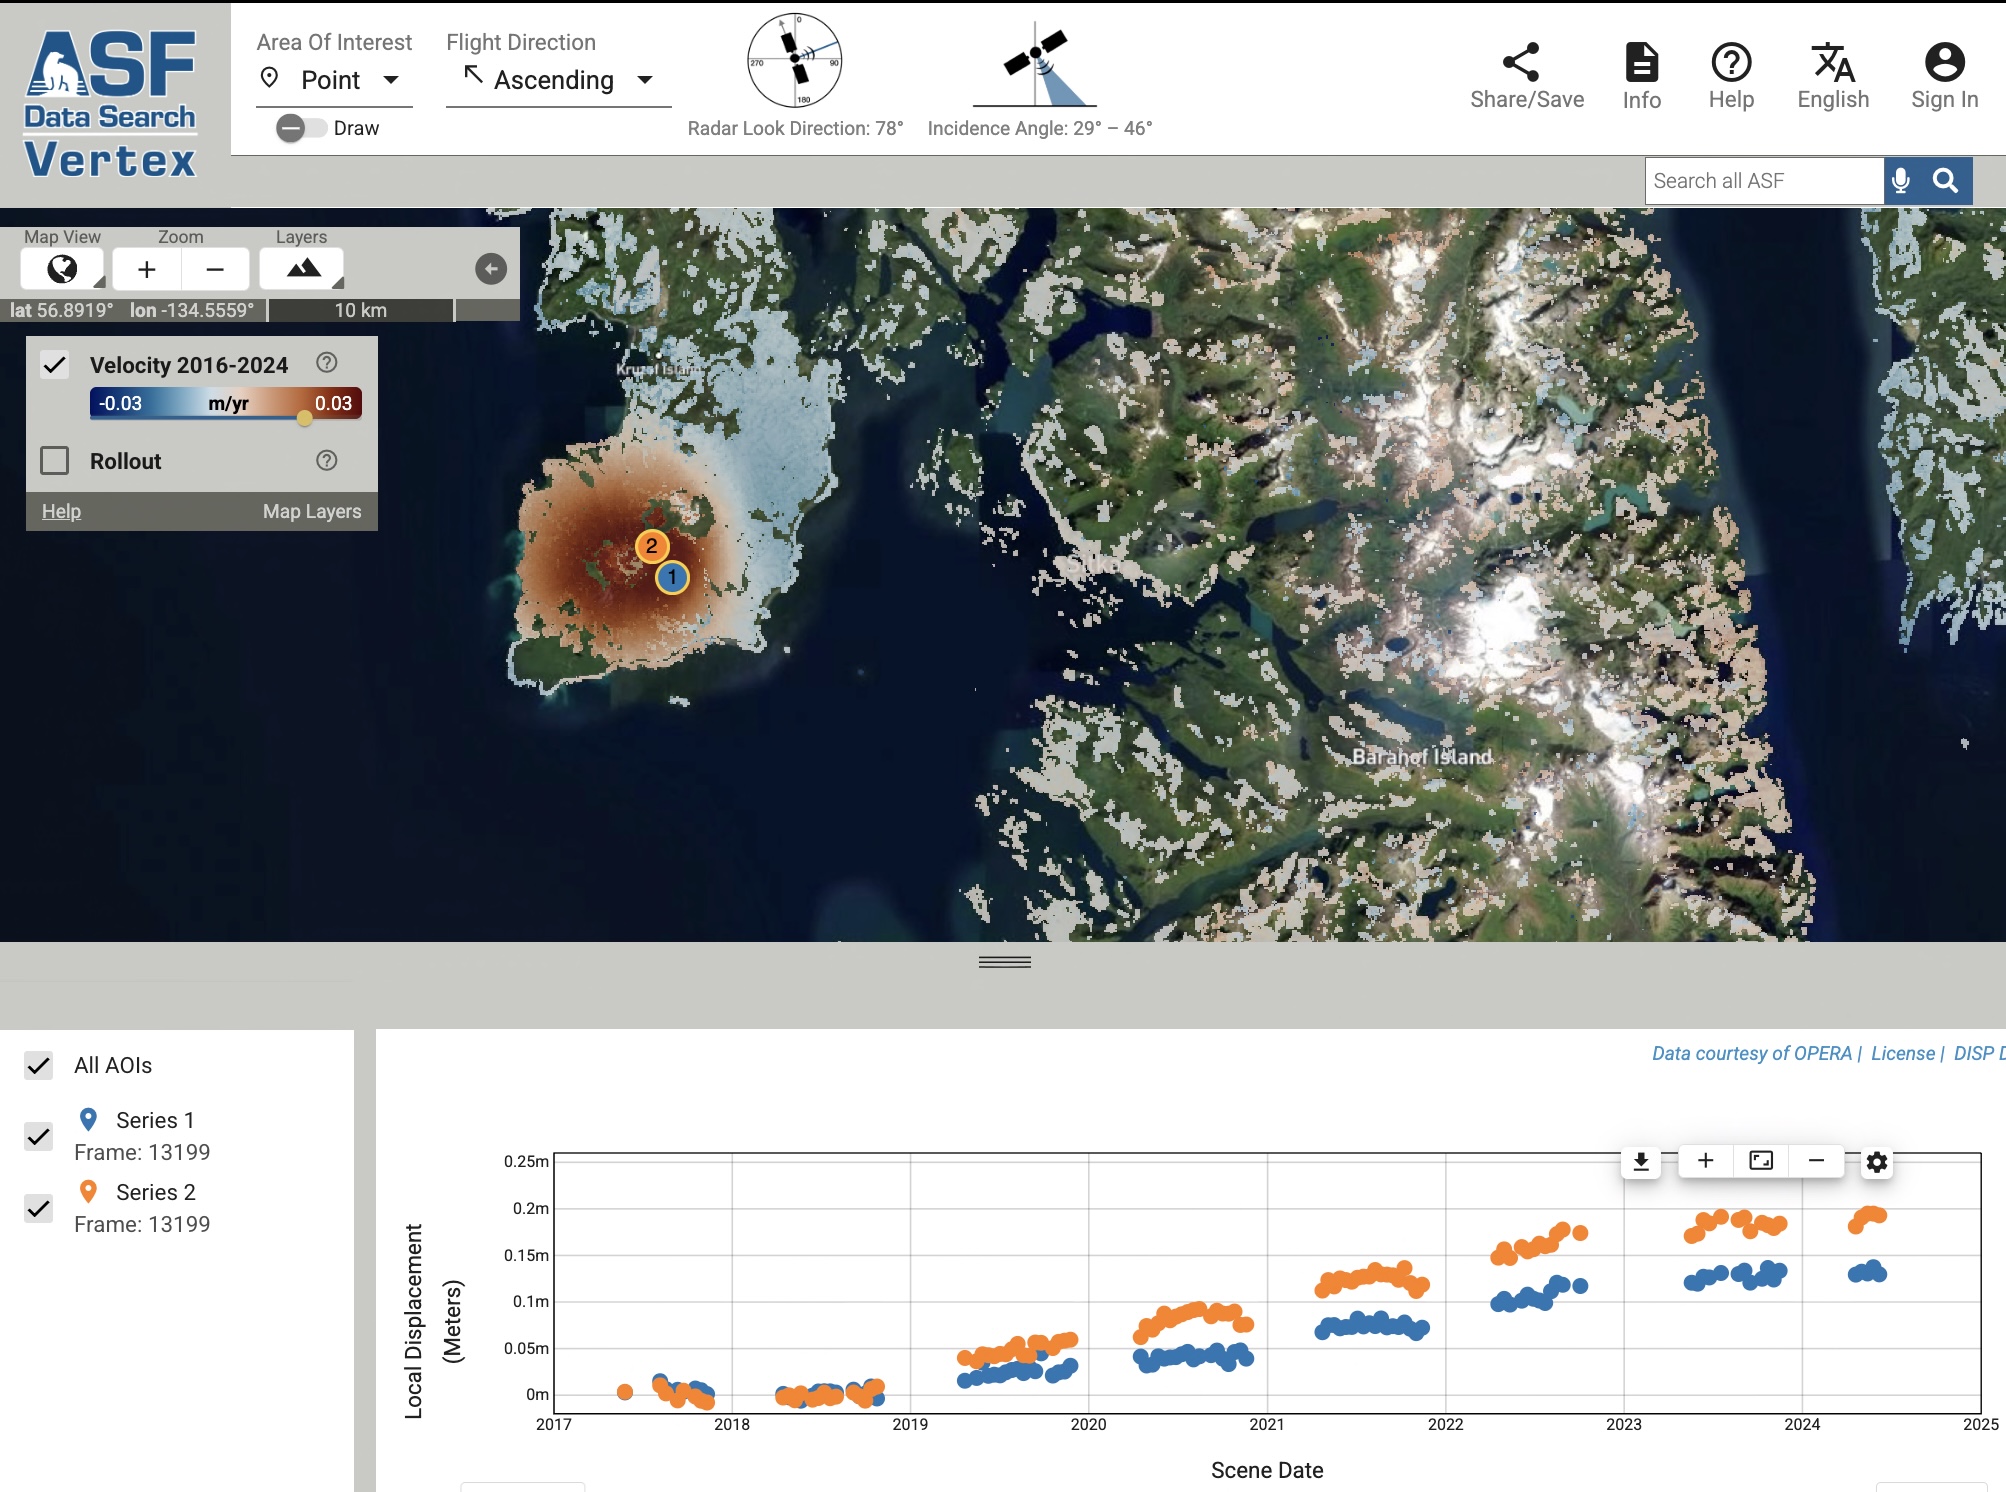
Shown above is a screenshot of the Displacement Portal, built by the Alaska Satellite Facility to browse the Displacement Products. The portal displays a “filtered” version of the displacement to highlight local displacement signals, like the ongoing deformation at Edgecumbe Volcano in Alaska:
During my Ph.D., I used InSAR to monitor surface changes over the Permian Basin in West Texas, the largest oil-producing region in the United States. To help mitigate the rising number of induced earthquakes, I worked with geologists and seismologists to deliver observational datasets and help understand the causes of the earthquakes. You can read reporting using my InSAR data on the recent implications from Bloomberg (video here).
You can find my full publication list on my Google Scholar profile, or browse my open source software associated with my research.
Research talks available online
EarthScope 2025 ISCE Short Course
I presented two talks at the EarthScope 2025 ISCE Short Course:
- InSAR Timeseries Analysis: theory and overview
- OPERA North America Surface Displacement Products with MintPy, using
dolphinfor high resolution PS/DS processing
2023 FRINGE (University of Leeds, UK)
Near-real-time estimation of ground displacement time series with InSAR