How SNAPHU uses the number of looks
\[ \newcommand{\pmi}{\operatorname{pmi}} \newcommand{\inner}[2]{\langle{#1}, {#2}\rangle} \newcommand{\Pb}{\operatorname{Pr}} \newcommand{\E}{\mathbb{E}} \newcommand{\RR}{\mathbf{R}} \newcommand{\script}[1]{\mathcal{#1}} \newcommand{\argmin}[2]{\underset{#1}{\operatorname{argmin}} {#2}} \newcommand{\optmin}[3]{ \begin{align*} & \underset{#1}{\text{minimize}} & & #2 \\ & \text{subject to} & & #3 \end{align*} } \newcommand{\optmax}[3]{ \begin{align*} & \underset{#1}{\text{maximize}} & & #2 \\ & \text{subject to} & & #3 \end{align*} } \newcommand{\optfind}[2]{ \begin{align*} & {\text{find}} & & #1 \\ & \text{subject to} & & #2 \end{align*} } \]
Varying the number of looks parameter in SNAPHU has a surprisingly large effect on the output, especially the connected component output. Why is that?
SNAPHU uses correlation in two places; both are simple equations, but I can’t actually map them to a single equation in the provided reference (Touzi, 1999).
- Calculate a $\rho_0$:
\(\rho_0 = \frac{c_1}{L} + c_2\) where $c_1 = 1.3, c_2 = 0.14$ are constants (whose defaults in SNAPHU I’m using here) and $L$ is the number of looks (probably the effective number of SAR looks).
- Using $\rho_{0}$, compute a low correlation threshold (from full configuration manual)
Values smaller than the threshold
rhominfactor*rho0are assumed to come from zero statistical correlation because of estimator bias (double).
So using the default in isce3’s snaphu min_corr_factor=1.25, correlation values smaller than
\(1.25 \cdot (\frac{c_1}{L} + c_2)\)
are assumed to indicate pixels which contain pure noise. Here’s what this threshold is for looks up to 50:
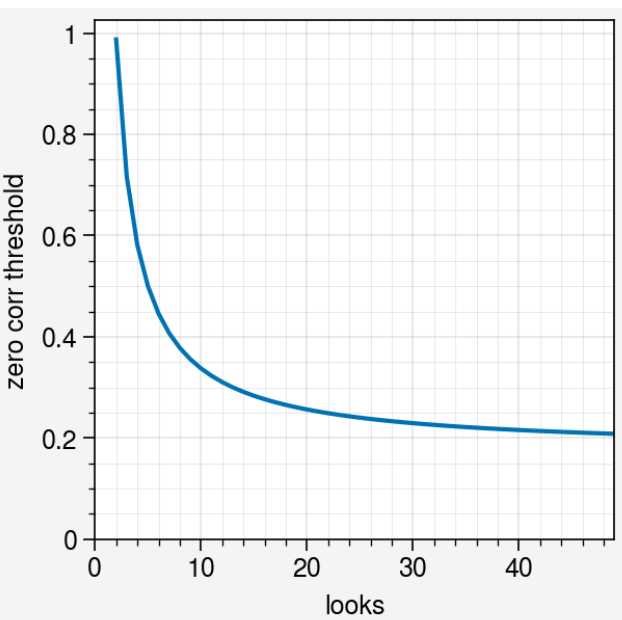
So we see that if your correlation value hits 0.2, SNAPHU is treating it as equal to 0 correlation.
Example
My go-to for weird unwrapping things is the UAVSAR Sacramento Delta example:
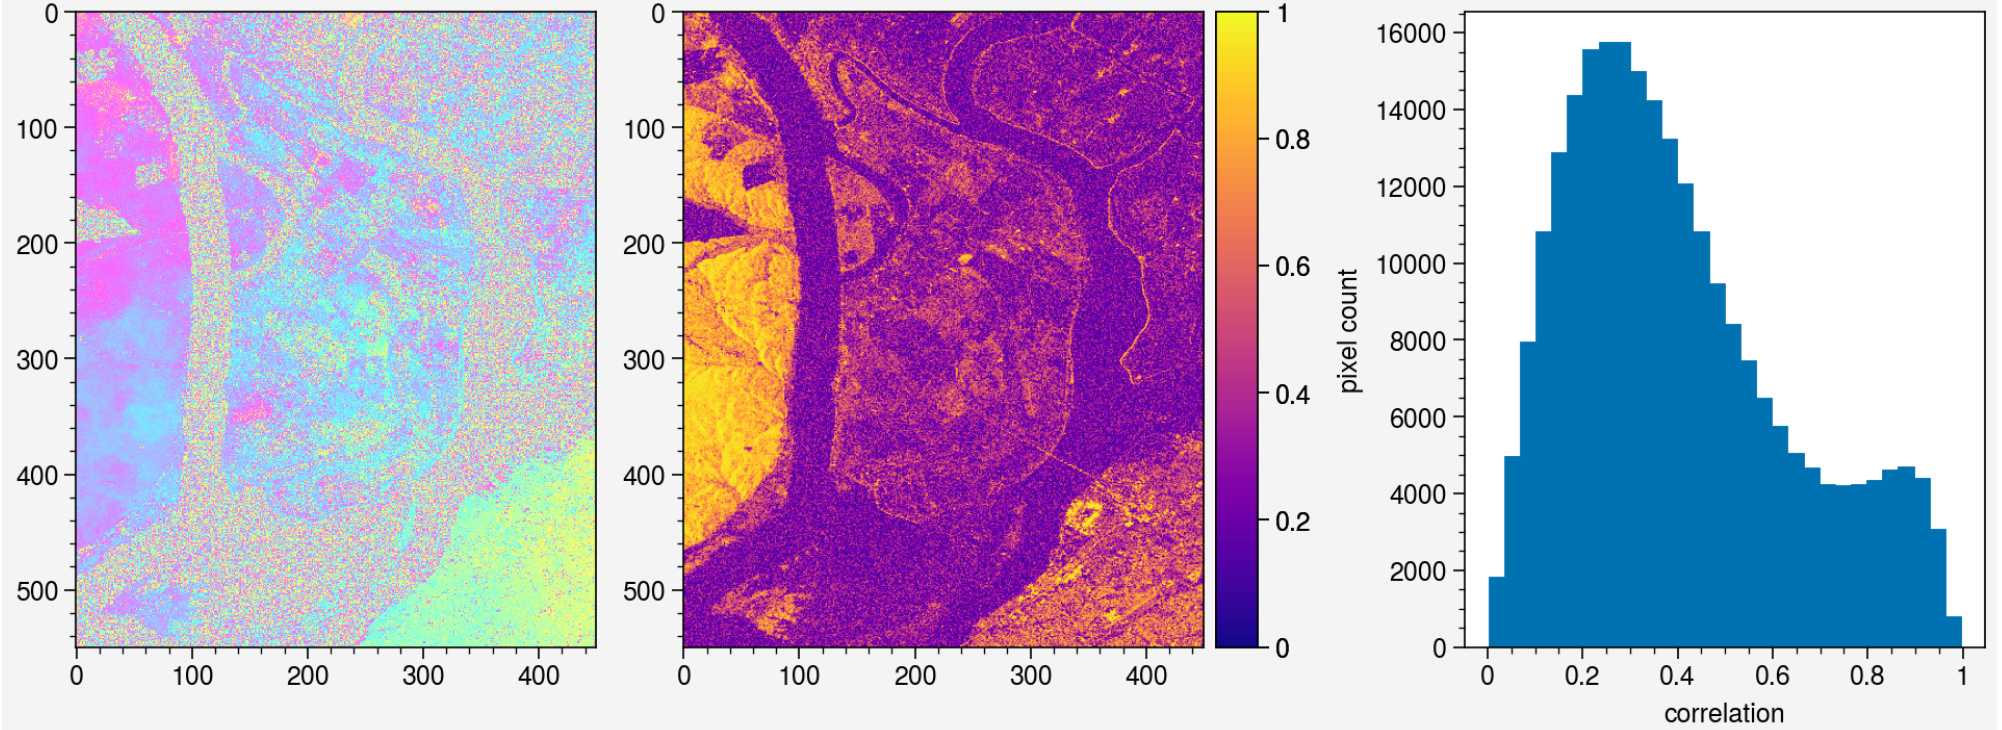
This is the phase, correlation, and histogram of correlation.
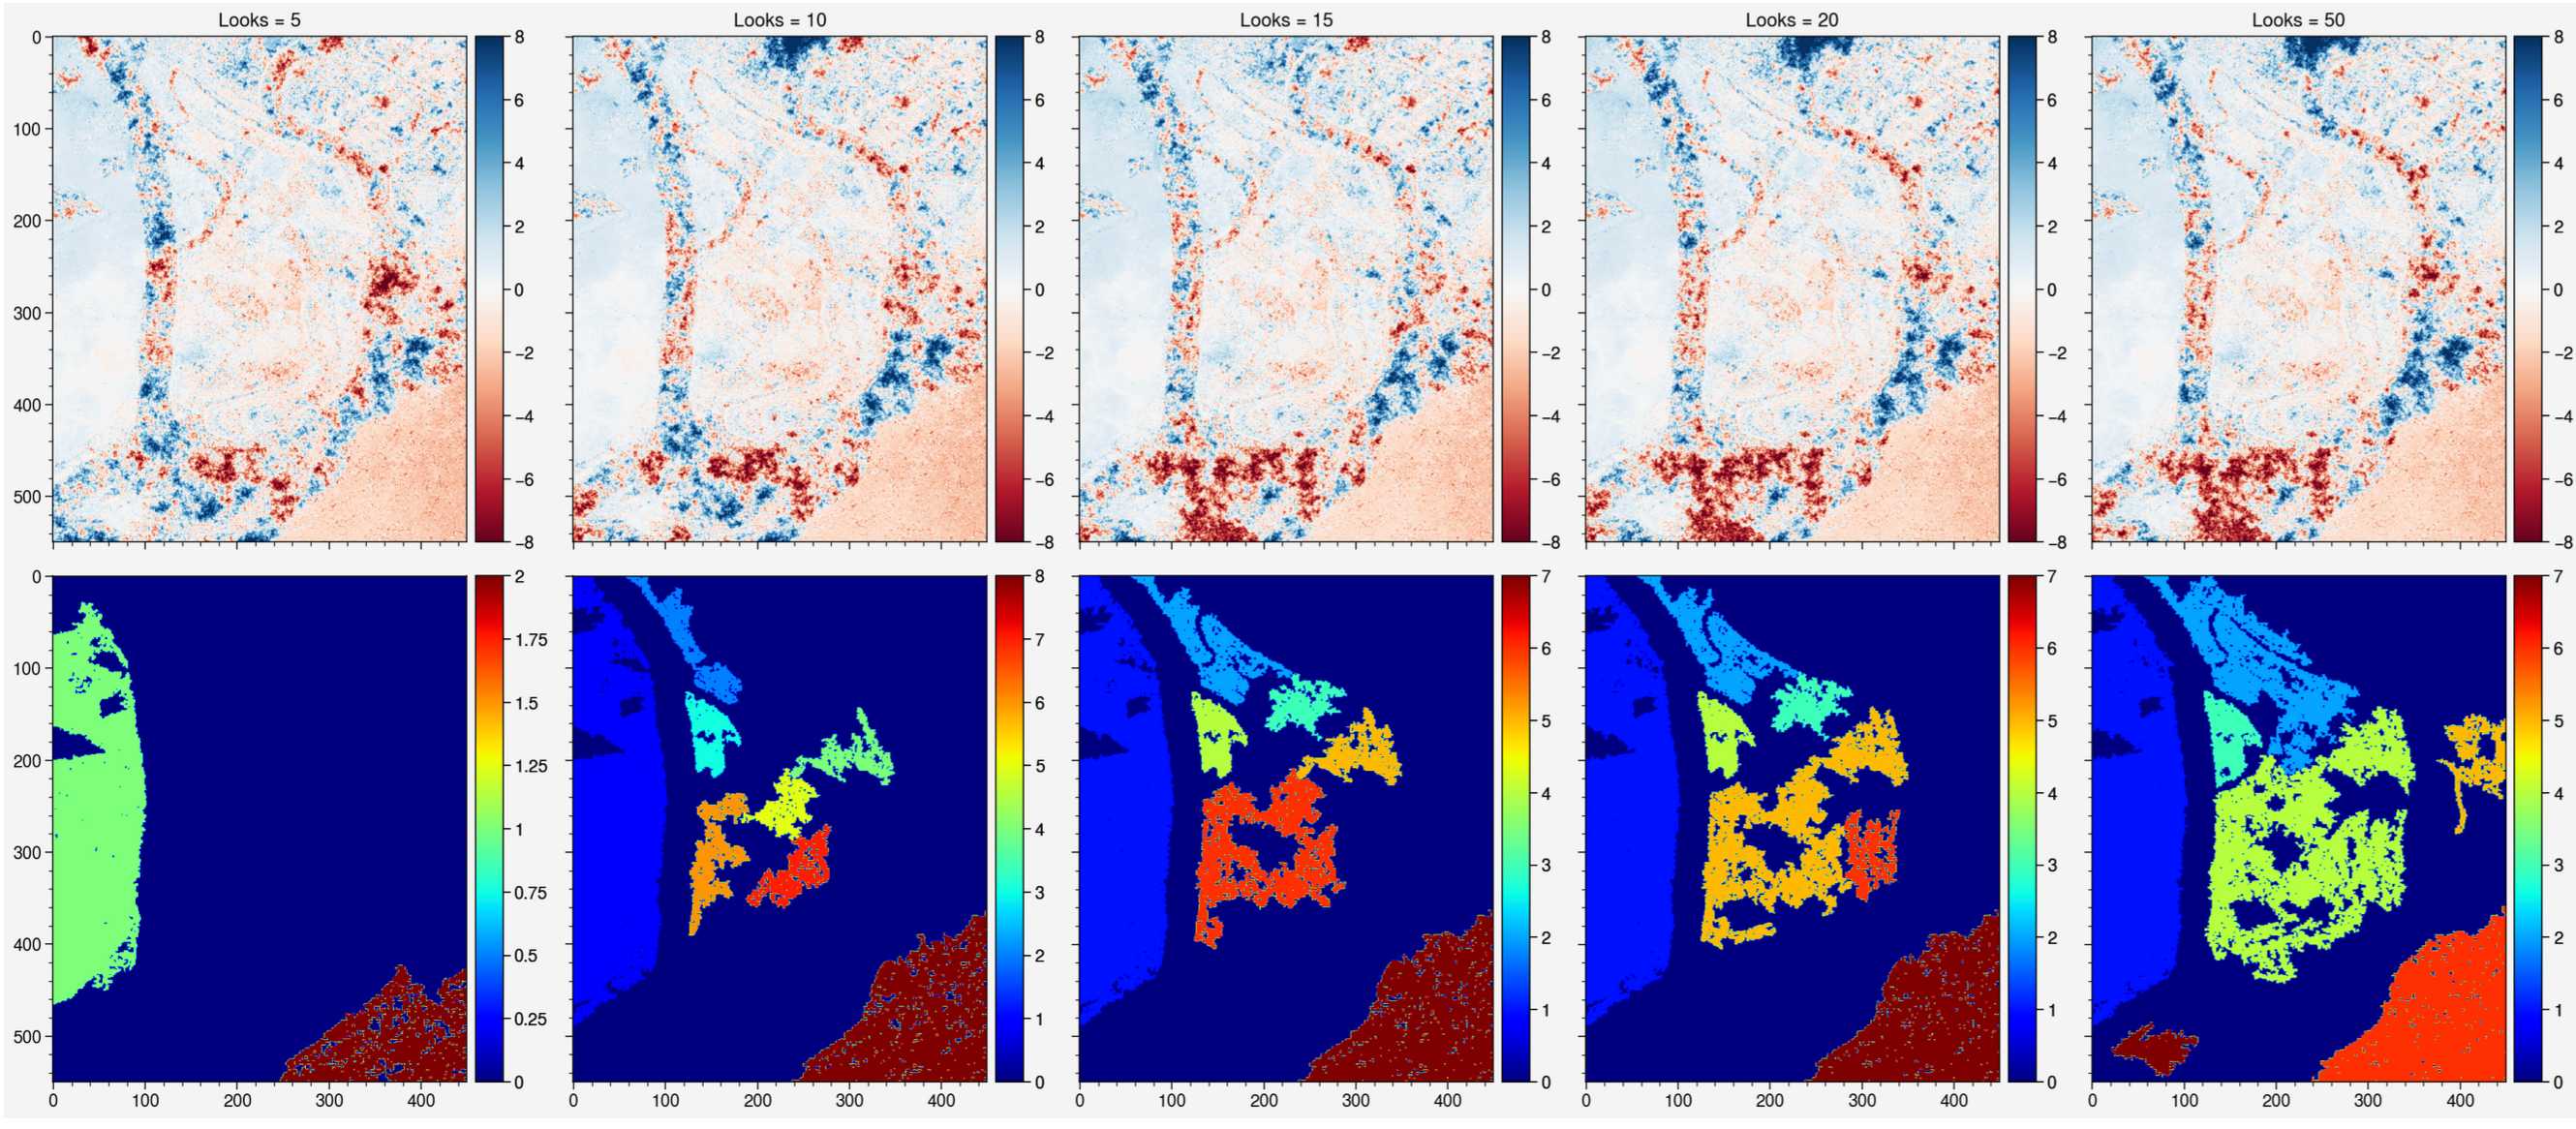
Unwrapping the interferogram with looks ranging from 5 to 50 gives this:
If we use the curve above to see which regions are ignored as 0 correlation for different input look numbers:
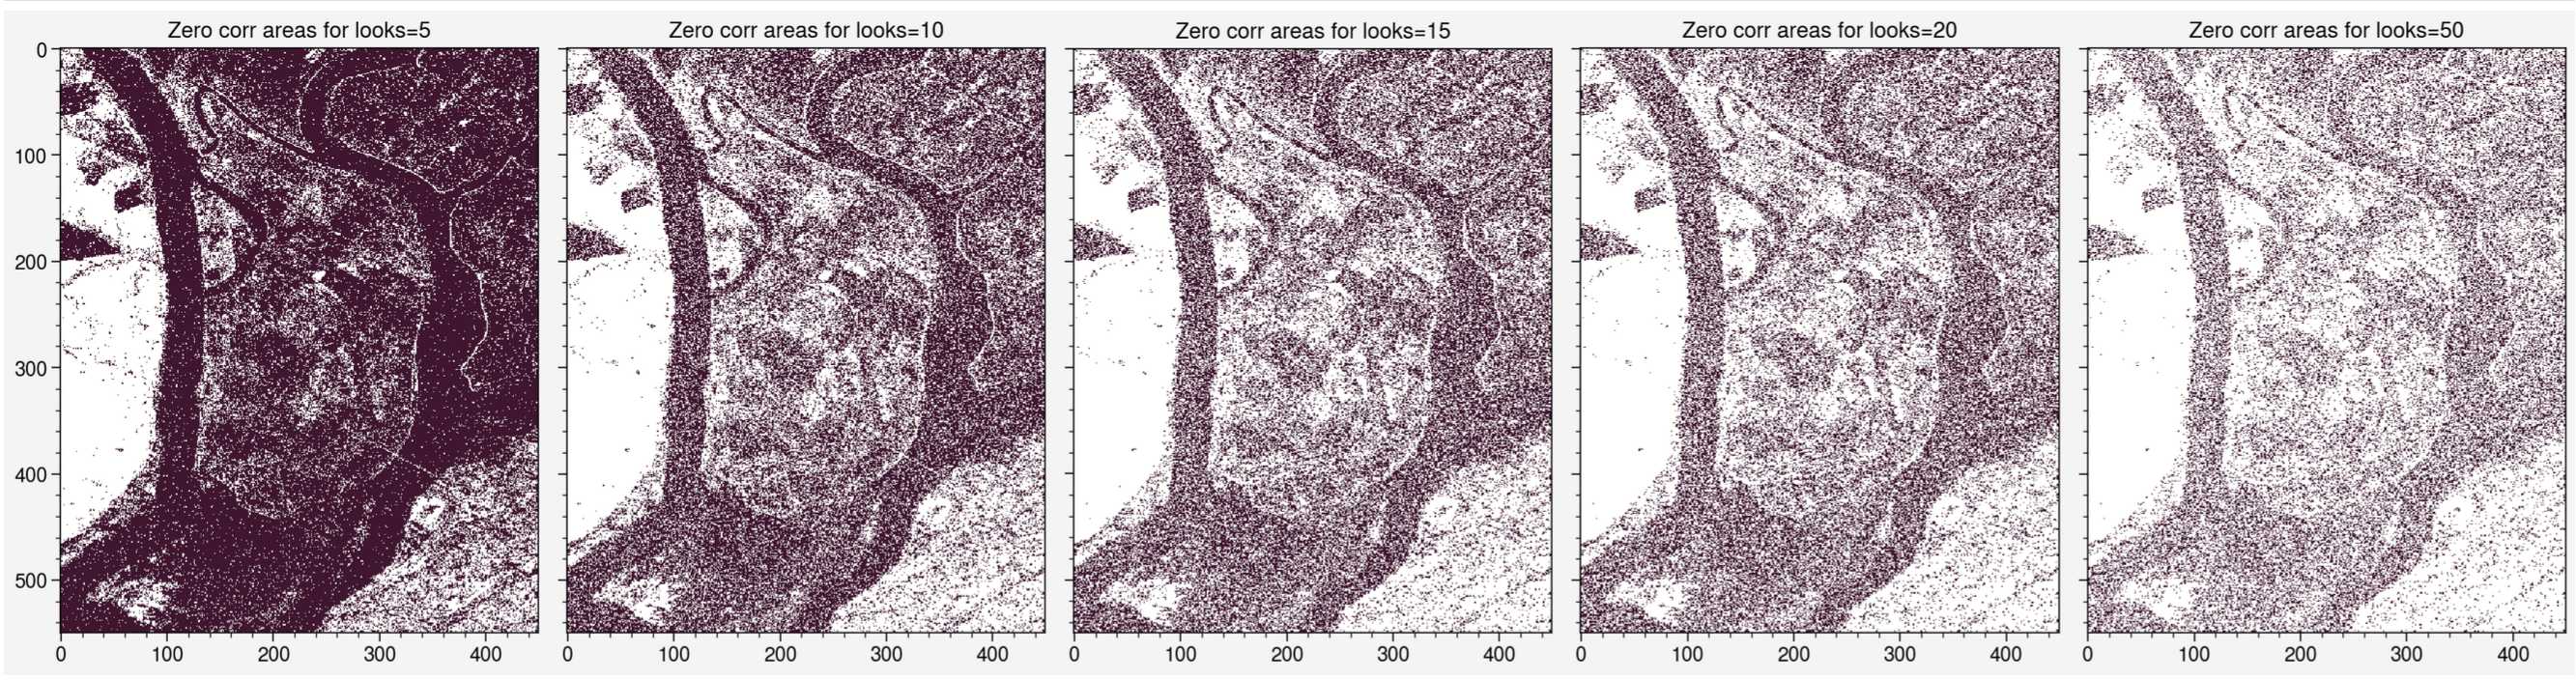
Comparing the two, it’s not obvious where you’ll get connected components just from looking at the masked regions. Worse still, you would have no chance of guessing where the connected components will be placed from the unwrapped phase alone (which looks mostly the same for all 5 cases).